Getting OSM data closer to reality
by multimob — written on 2022-07-12
Mapping public transport is particularly challenging if the network is large and if you have a lot of outdated data on the map.
Take any PT-related data and try to imagine how it can be in OSM. This goes for stops but also for routes, accessories or even tags for any of those objects.
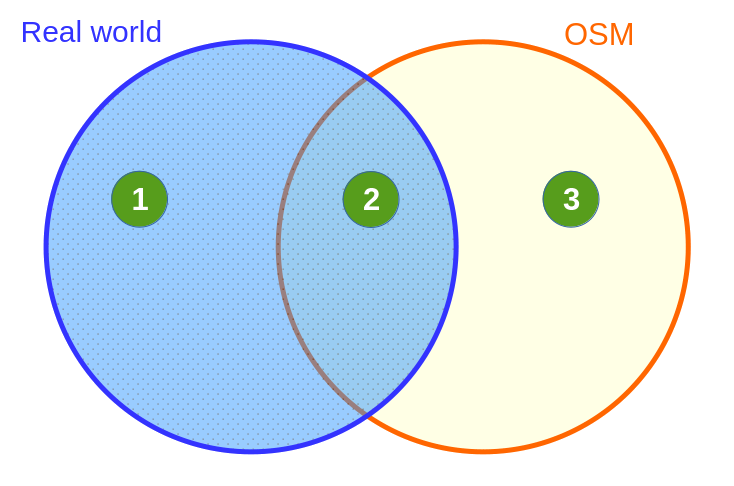
Any such object can fall into 3 possible categories.
- It exists in the real world but it is not on OSM. This is "missing data".
- It exists in the real world and is properly tagged on OSM. This is "correct data".
- It does not exist in the real world but it still on OSM. This is "incorrect data".
The general objective will be to identify and add all the objects in category 1, and identify and remove all the objects in category 3.
This looks extremely simple but it is not. De Lijn alone has about 30,000 bus stops and 600 different routes. You cannot expect to "just survey" each of them one by one; it will take way too much time and resources and the day you have visited all those places, new changes have occurred. To complicate the matter, temporary roadworks make it difficult to observe the latest situation.
Two solutions come to rescue for large-scale fixes: aerial imagery/street-level photos, or GTFS provided by the operators.
GTFS as the saviour of public transport mapping
GTFS is immensely popular with programmers because they will very quickly assume that it is a perfect mirror of reality to describe a public transport network.
After all, since GTFS is produced by the public transport operator itself, the location of stops must be correct, so will the names, so will the timetables, and everything.
In that case, things become trivial. You assume that GTFS is reality, which is conveniently offered as a well-ordered group of plain text files containing everything you need to know, and you can easily determine whether a stop falls into category 1, 2 or 3. A few handy scripts and you can import an entire network in a couple of hours.
Some people go as far as to say that public transport should not be mapped at all in OSM and should be entirely managed by GTFS data, producing its own data layer, which could be automatically regenerated every day.
GTFS is not reality
Years of experience with public transport planning consolidated an opinion that GTFS may be close to reality but it is definitely not reality. The larger the network, the highest the gap is between GTFS and the real world.
Here is a more accurate description of the situation of public transport mapping.
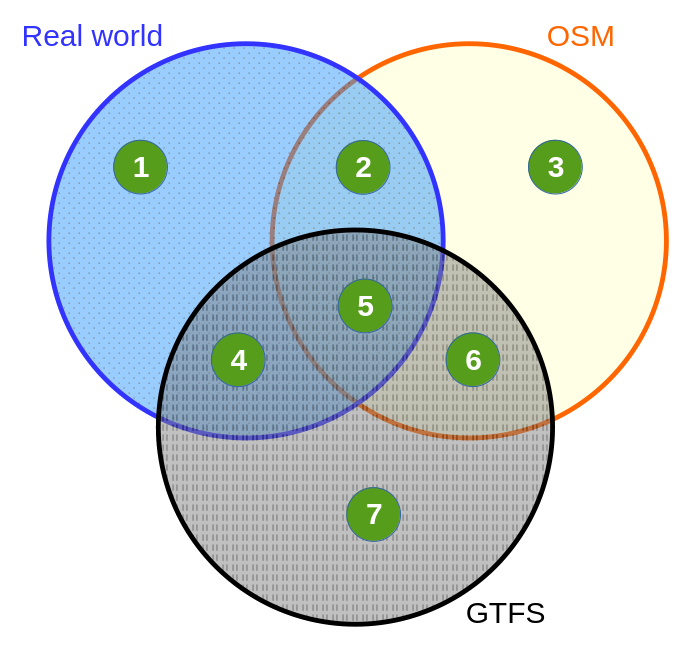
- Typically an extra bus stop in multi-platform bus stations, or a new stop that was recently added but never made its way into official data
- Good mappers have come here and found real objects, though they are missing in official data
- Outdated data or incorrect data that was added by mistake
- Real data which should be added to OSM
- Data is correct and properly mapped
- A stop was moved recently, the information is not yet reflected in the operator’s internal database or might have been overlooked
- Same as previous but it was never added to OSM. Also valid for virtual stops used for planning purposes, or service stops that were removed years ago.
This chart is not just about whether bus stops are present or not on the map, this is about any type of information, it can be the correct way to name a bus stop, the list of routes using it, etc.
As we can see, any effort that tries to get OSM to reflect GTFS data will be a push to get the orange circle closer to the black circle. It will therefore add missing data (category 4) and get rid of incorrect data (category 3) but will also destroy existing good data (category 2) while inserting wrong data (category 7). And as we mentioned earlier, experience suggests that a significant share of the network falls into those categories.
No, it's definitely not easy.
Permalink: https://blog.multimob.be/zznfuf32fq.htm